Table of Contents
Scalasca
Scalasca is a software tool that supports the performance optimization of parallel programs by measuring and analyzing their runtime behavior. The analysis identifies potential performance bottlenecks – in particular those concerning communication and synchronization – and offers guidance in exploring their causes.
Architecture
Scalasca supports a basic performance analysis workflow where, the instrumentation of the application of interest is done before any performance data can be collected, i.e. probes must be inserted into the code that carry out the measurements. The figure below shows the performance analysis workflow supported by Scalasca (from www.scalasca.org).
Application Instrumentation
Before using Scalasca Trace Tools, applications of interest first need to be instrumented. The instrumentation is done using the community instrumentation and measurement infrastructure Score-P. The instrumentation can happen at different levels, including source code, object code, or library. Before running the instrumented executable on the parallel machine, the user can choose between generating a runtime summary report or an event trace. Alternatively, When tracing is enabled, each process generates a trace file containing records for its process-local events.
Depending on the size of the code or library being instrumented, the traces generated can become too large for the memory, and to avoid that traces become too large or inaccurate as a result of measurement intrusion, it is generally recommended to optimize the instrumentation based on a previously generated summary report. After program termination, Scalasca loads the trace files into main memory and analyzes them in parallel using as many cores as have been used for the target application itself.
Besides the summary, Scalasca also generates wait-state reports. During the analysis, Scalasca searches for wait states, classifies detected instances by category, and quantifies their significance. The result is a wait-state report similar in structure to the summary report but enriched with higher-level communication and synchronization inefficiency metrics. Both summary and wait-state reports contain performance metrics for every combination of function call path and process/thread and can be interactively examined in the provided analysis report explorer along the dimensions performance metric, call tree, and system.
Additionally, Scalasca reports can be combined or manipulated to allow comparisons or aggregations, or to focus the analysis on specific extracts of a report. For example, the difference between two reports can be calculated to assess the effectiveness of an optimization or a new report can be generated after eliminating uninteresting phases (e.g., initialization).
Functionality
Scalasca takes performance measurements at runtime to be analyzed postmortem (i.e., after program termination) and can be used in two different analysis modes:
- Profile mode: Performance overview on the call-path level via runtime summarization
- Trace mode: In-depth study of application behavior via event tracing
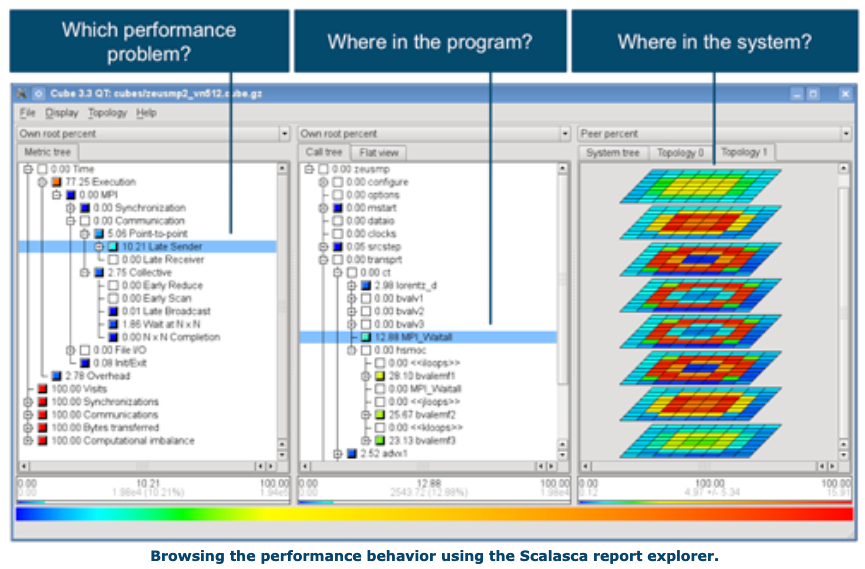
In profiling mode, Scalasca generates aggregate performance metrics for individual function call paths, which are useful to identify the most resource-intensive parts of the program and to analyze process-local metrics such as those derived from hardware counters. While, In tracing mode, Scalasca goes one step further and records individual performance-relevant events, allowing the automatic identification of call paths that exhibit wait states. In both cases, the resulting reports can be interactively explored in a graphical browser as shown in the figure below (from www.scalasca.org)..
Quick Start in SCC
- Scalasca Trace Tools are available in SCC together with the necessary instrumentation tool Score-P. Before using Scalasca a user need to load their preferred Scalasca version module to set the environment correctly.
(base) gwdu101:25 17:17:18 ~ > module show scalasca
-----------------------------------------------------------------------------------------------------------------------------------------------------------------------------
  /opt/sw/modules/21.12/cascadelake/Core/scalasca/2.6.lua:
-----------------------------------------------------------------------------------------------------------------------------------------------------------------------------
...

(base) gwdu101:25 17:17:24 ~ >
(base) gwdu101:25 17:18:33 ~ > module load scalasca
(base) gwdu101:25 17:18:43 ~ >
Additional information
For additional information, visit.
- [Scalasca](https://www.scalasca.org/)


